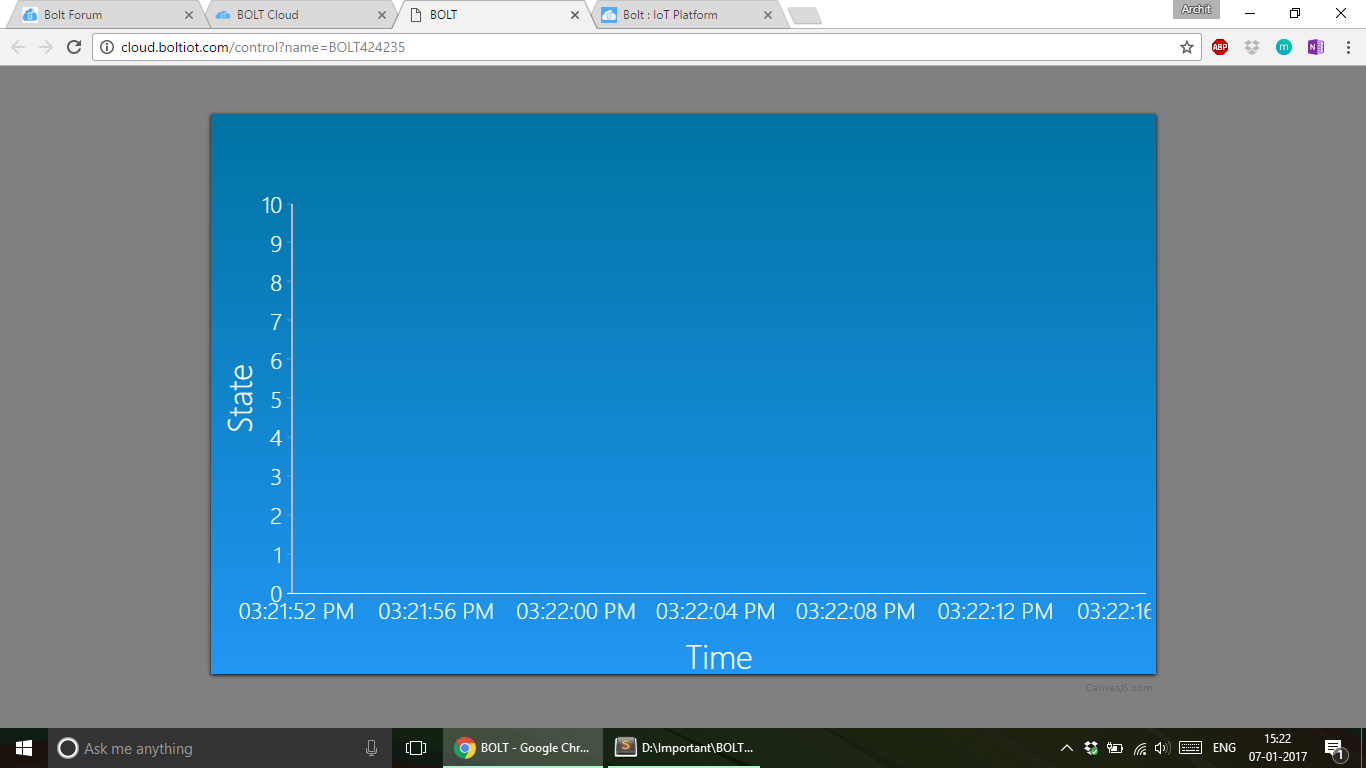
I get this when the page loads and there is no obstacle in front of the sensor.

I get this once I put my hand on top of the sensor. After that it stays like this even though there is no obstacle.
I get this when the page loads and there is no obstacle in front of the sensor.
I get this once I put my hand on top of the sensor. After that it stays like this even though there is no obstacle.
Please follow the instructions given here for data visualisation: https://www.boltiot.com/workshop-content-beta.php
1)Even I am facing a similar issue. Either the graph displays as shown above or does not display at all. Axes are visible but not the data read by the sensor.
2)I am also facing other problems with cloud. Even when I upload a normal LED controller page, it does not work when accessed from the cloud. It only works when I access it using the ip address of bolt.
3)What is in the file bolt.html? I accidentally set the page for device type ‘bolt’ to some other file and now I am not able to see bolt.html in the dropdown list. Can I get the bolt.html file again?
4)How to delete uploaded pages which we are no longer going to use?
1)Even I am facing a similar issue. Either the graph displays as shown above or does not display at all. Axes are visible but not the data read by the sensor.
Did you try the link https://www.boltiot.com/workshop-content-beta.php1?
2)I am also facing other problems with cloud. Even when I upload a normal LED controller page, it does not work when accessed from the cloud. It only works when I access it using the ip address of bolt.
Please share your code. Note that the commands are little diffrent when you access via the cloud.
3)What is in the file bolt.html? I accidentally set the page for device type ‘bolt’ to some other file and now I am not able to see bolt.html in the dropdown list. Can I get the bolt.html file again?
Not sure what ut includes. But if its not particularly useful then I suggest you ignore it.
4)How to delete uploaded pages which we are no longer going to use?
You cannot delete them as of now. You can replace them tough. Just upload a file with the same name to replace.
Yes. I tried the storage configuration procedure on the link https://www.boltiot.com/workshop-content-beta.php. It did not work. I keep getting a blank graph i.e. I can see only the axes and not the data.
My LED Controller Code-
When I click on the LED ON from the cloud, I get the message {success: 0; command unsuccessful}.
I am unable to control the LED over the cloud.
Hi,
Have you replaced the BOLTXXXXXX with your BOLT serial number example BOLT312425 ?
Yes. I have replaced BOLTxxxxxx with the number of my Bolt.
Have you tried using the digital Write command directly from cloud URL
Example
cloud.boltiot.com/digitalWrite?pin=0&state=HIGH&deviceName=BOLT123456
Please try the same and tell me the output
I get the output:
{“success”: “0”, “value”: “command unsuccessful”}
LED cannot be controlled.
Is your firmware version updated to the latest? Visit IPAddress/Settings and click on the update button. Let us know the firmware version after you update.
Also, share the code you used for the data visualisation process along with the screenshot of your storage configuration.
i am also facing the same issue. unable to send data to cloud.
Do let us know the answers to the questions above i.e. Is your firmware version updated to the latest? Visit IPAddress/Settings and click on the update button. Let us know the firmware version after you update.
Also, share the code you used for the data visualisation process along with the screenshot of your storage configuration.
After updating, hardware version is 1.3.0 and firmware version is 2.2.3.
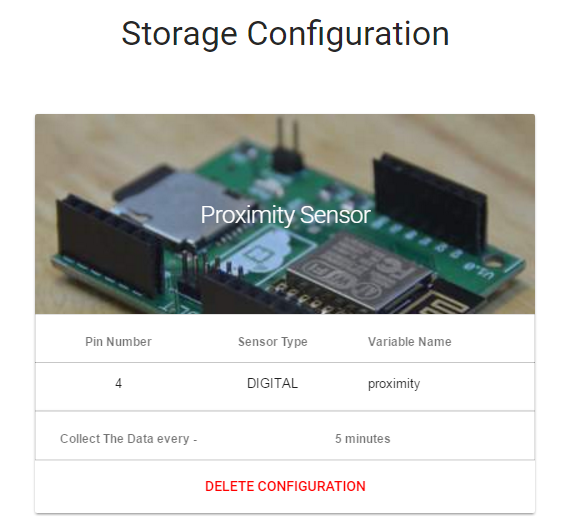
Screenshot of Storage configuration for proximity sensor:
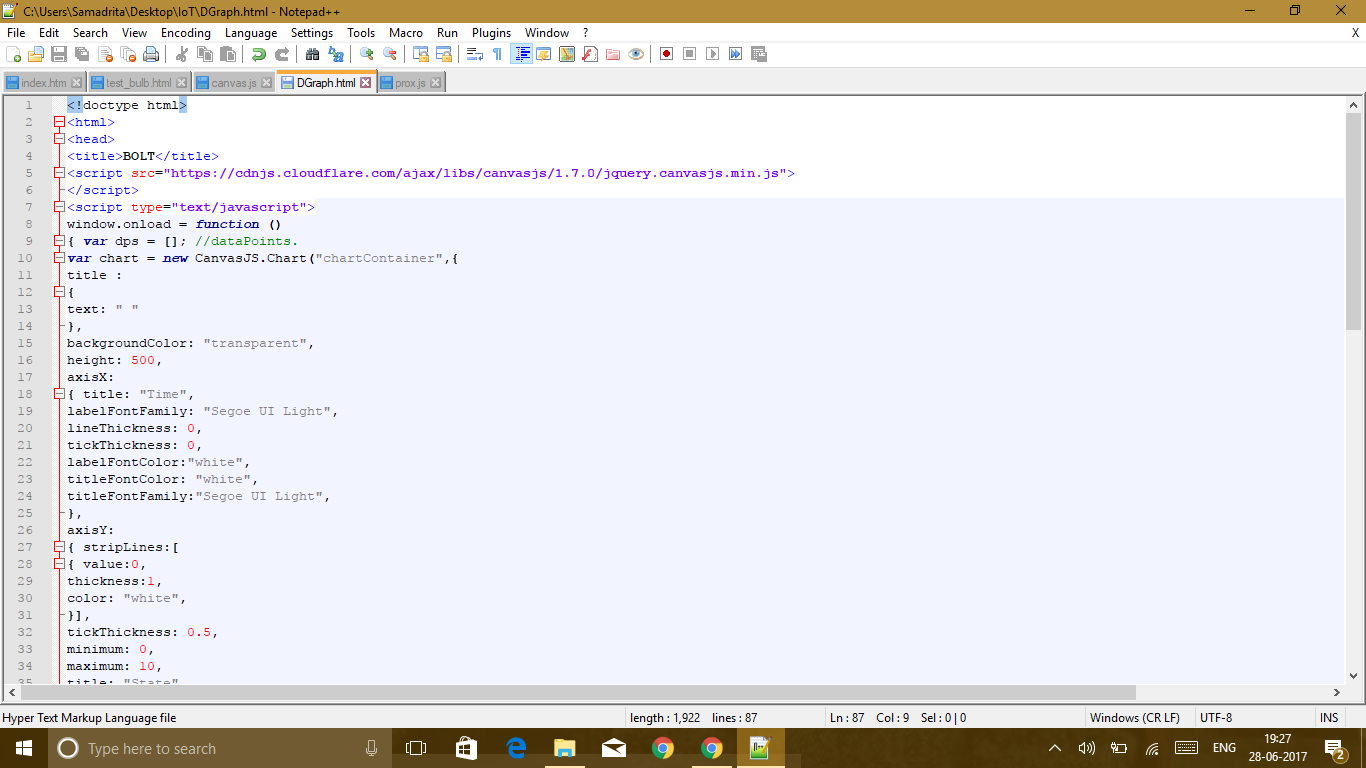
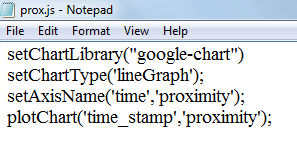
Screenshot of code for data visualization (prox.js file uploaded for device type proximity sensor)
It seems fine. Please send a video while triggering the proximity sensor (Upload on youtube and share link here). Have you correctly connected it to pin 4?
Also, does the red LED on the proximity sensor glow when obstacle is detected?
Sorry for the trouble you are facing.
Note: Post only queries regarding data visualisation in this thread. For questions on glowing LED, please post in another thread.
The connection is correct. The red LED on the proximity sensor glows when an obstacle is detected.
Have you considered that the data will be updated every 5 minutes and not real time? Try connecting LDR to A0 and keep it on for 1 hour. Check the graph post that.
Sir, I am having the same issue.
The graph is going upwards at first and then there is no reading.
And how to connect to the prox.js file through the HTML file?
@ghoshsamadrita3
Please share your code. Also, you can refer this thread. Data visualization no graph plot