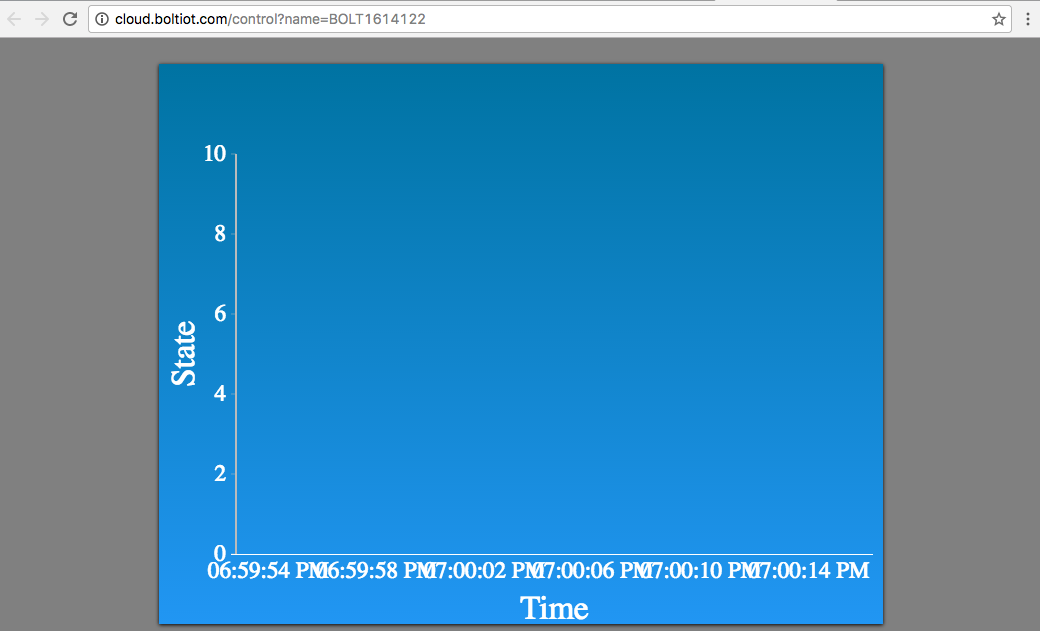
After connecting to bolt cloud and uploading canvas.js and index.html to the bolt via d cloud and the adding new type and all dos steps shown in d video. Reaching d last step, i.e click on the bolt icon on the main page…it shoes u only the x and y axis of the graph. The grap is not displaying. The 1st tym I had done dis had worked. Again the next day wen I clicked on the icon, oly the x axis a d y axis was displaying n no graph.
Pls help me out with this.
Can u share the code here ?
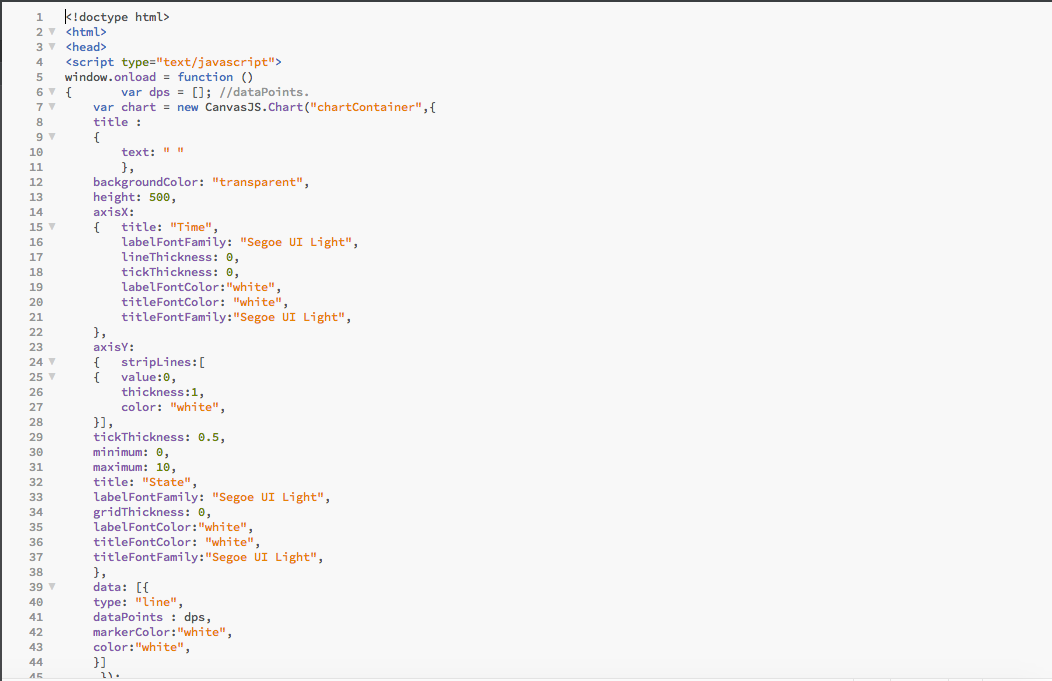
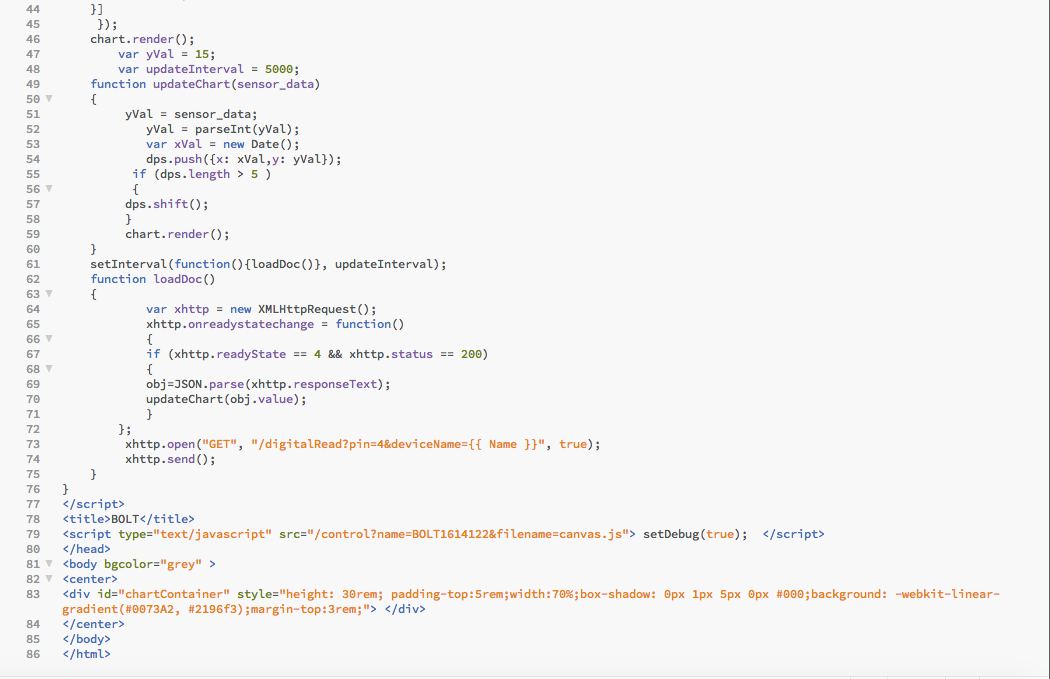
i uploaded the canvas.js file ans the following code
<!doctype html>
BOLT<!doctype html>
BOLTNo sir M not getting it.Uploading…
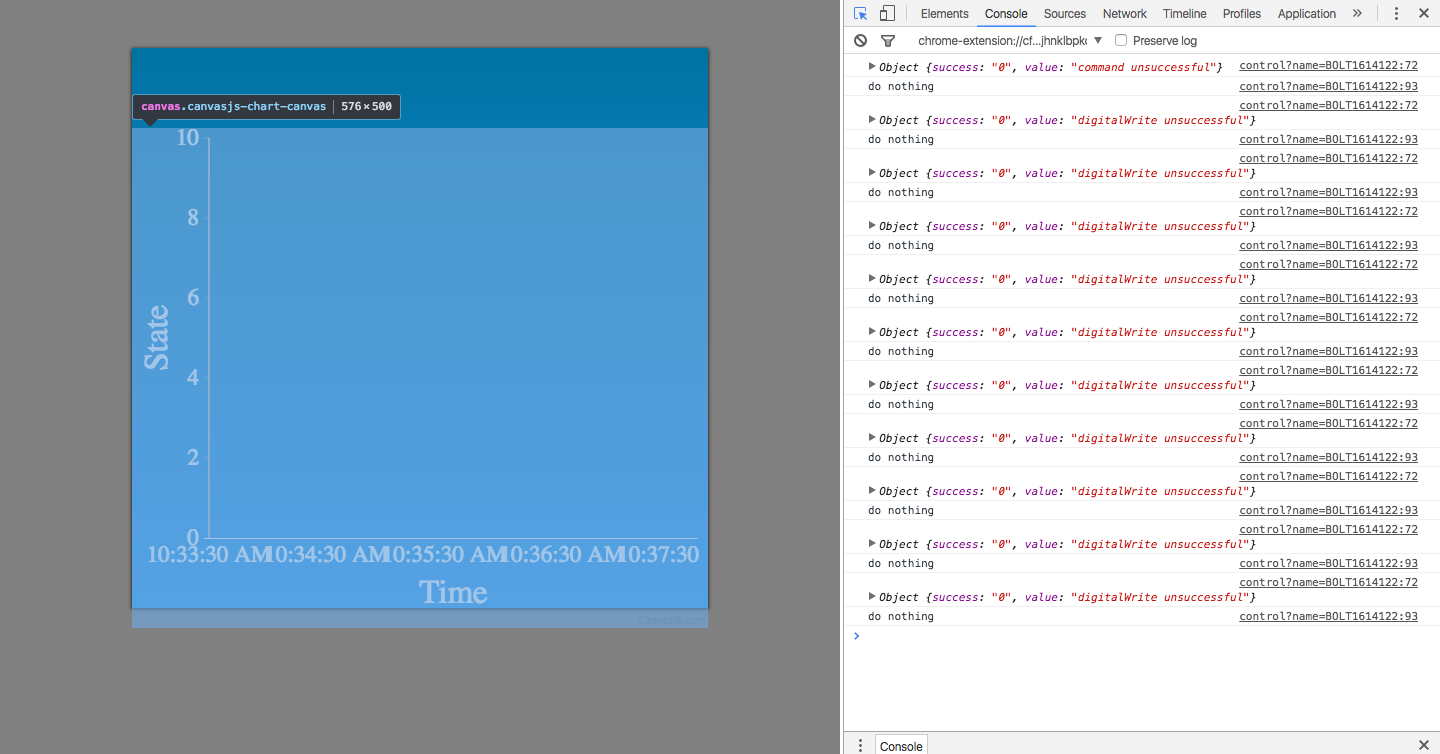
Dis is all M getting. No graph.The proximity sensor is connected to d bolt via pin4.
Please share your code as a file. Pasting HTML file directly on Bolt Forum converts it into an HTML output.
i also tried replacing this line
with this:

Hi, can you share the device with me so that I can have a look. My email id is pranav.kundaikar@inventrom.com
To share the device, click on the Users button under the device in you Bolt cloud homepage. Then enter my email id in and press enter and share.
I have added you as the user. Please check as soon as possible
put this line after the line below console.log(yVal);
yVal = parseInt(yVal);
console.log(yVal);
no, there is no change… still i don’t get the graph
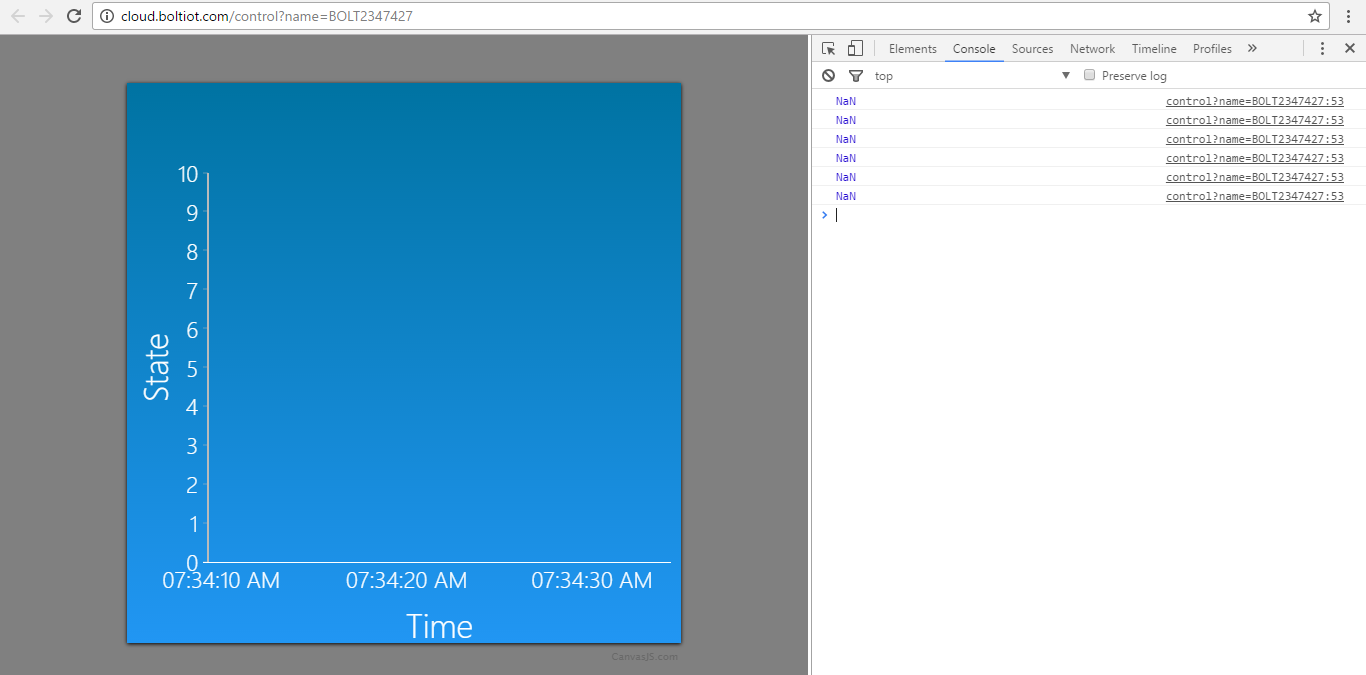
Once you do the above step, right-click on the page and select inspect element option. This will open a window on the right-hand side click on console option there and refresh the page. Some data will be printed once the page loads. Send a screenshot of that.
yes the device was on