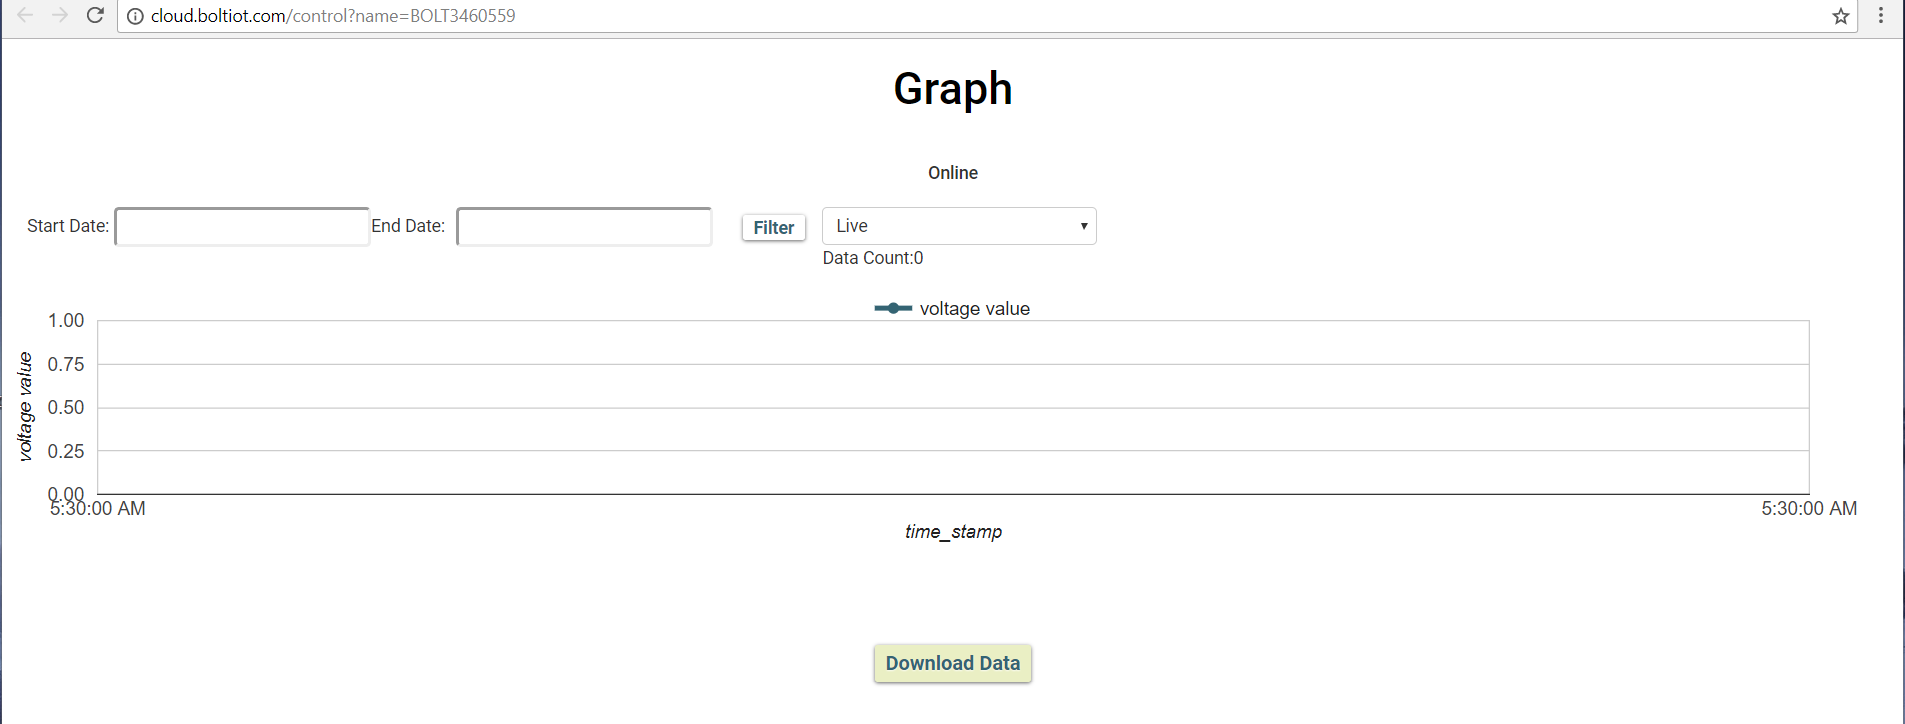
In data visualization i am not getting graph what should i do?
Please attach a screenshot of your code and hardware configuration.
So that, we can assist you better.
Provide your code and picture of your output and hardware configurations

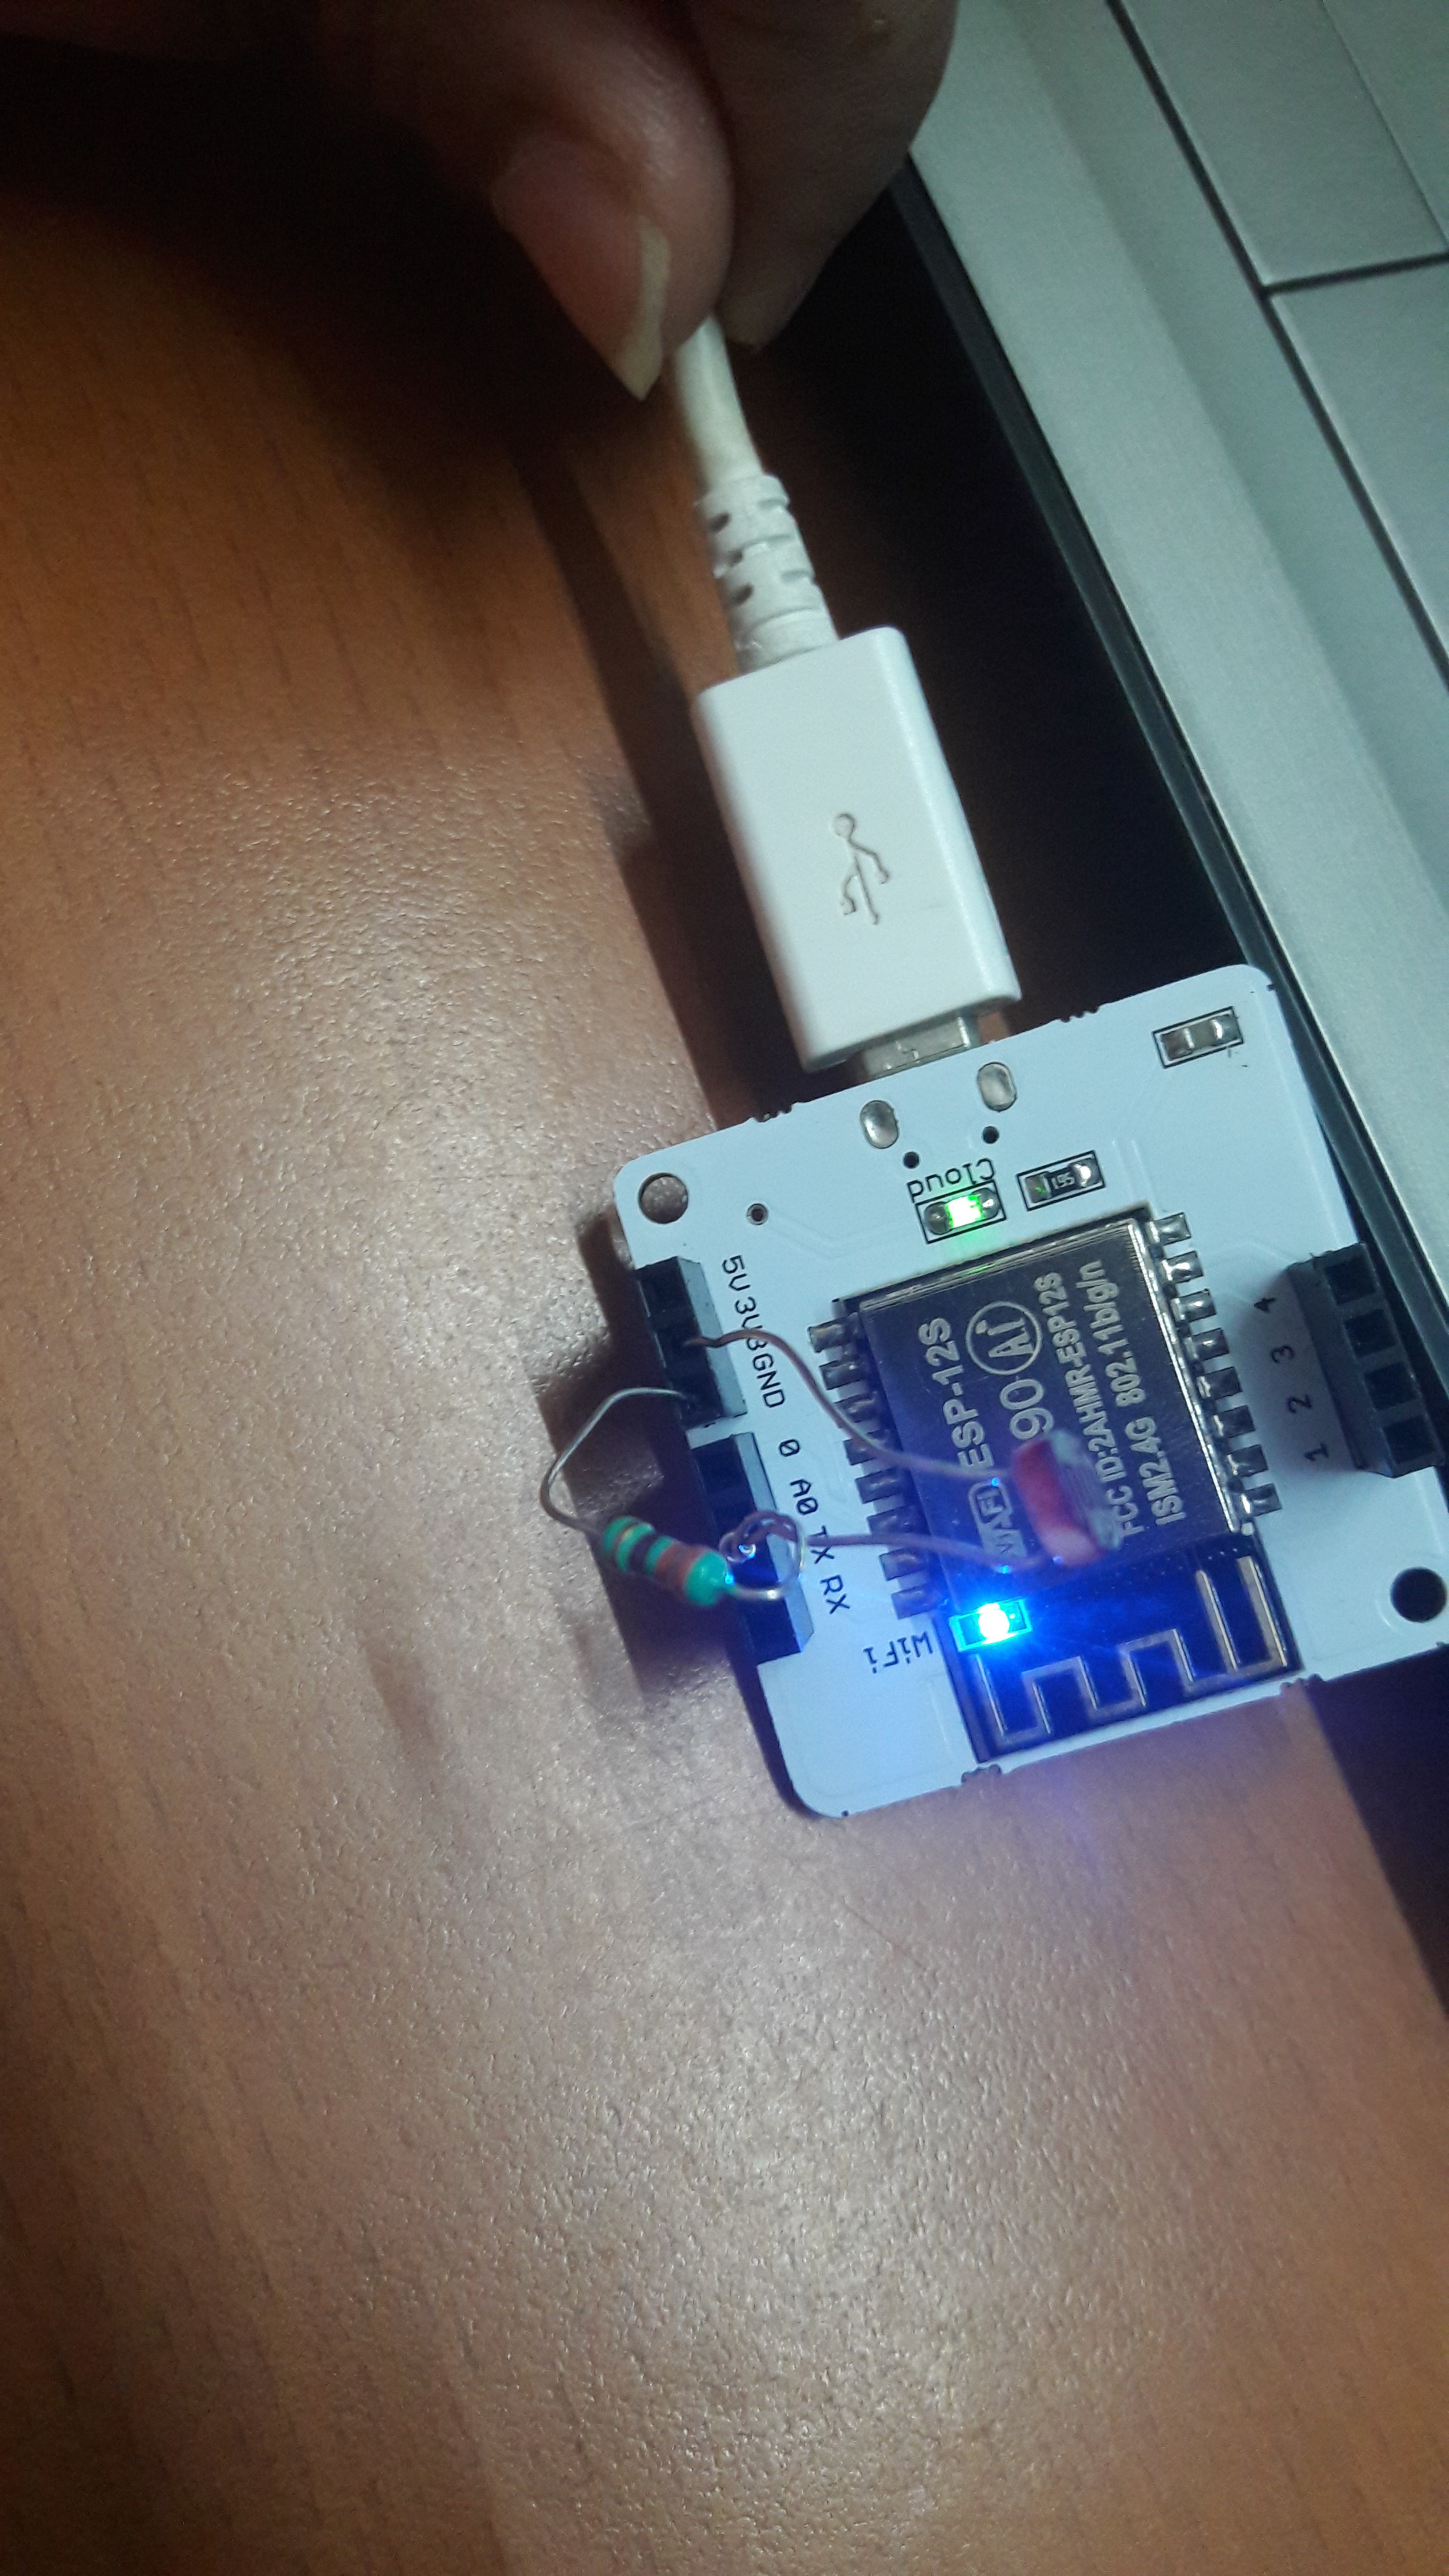
collecting light data from ldr after every 5 mins duration
one terminal of ldr and resistor are connected and put in A0 pin of bolt
another pin of ldr is connected to 3.3v and resistor is connected to GND
Hi,
What do you get when you click on the download data button? also send a screenshot of your hardware config of your product
1 Like
Hi @bolta174 ,
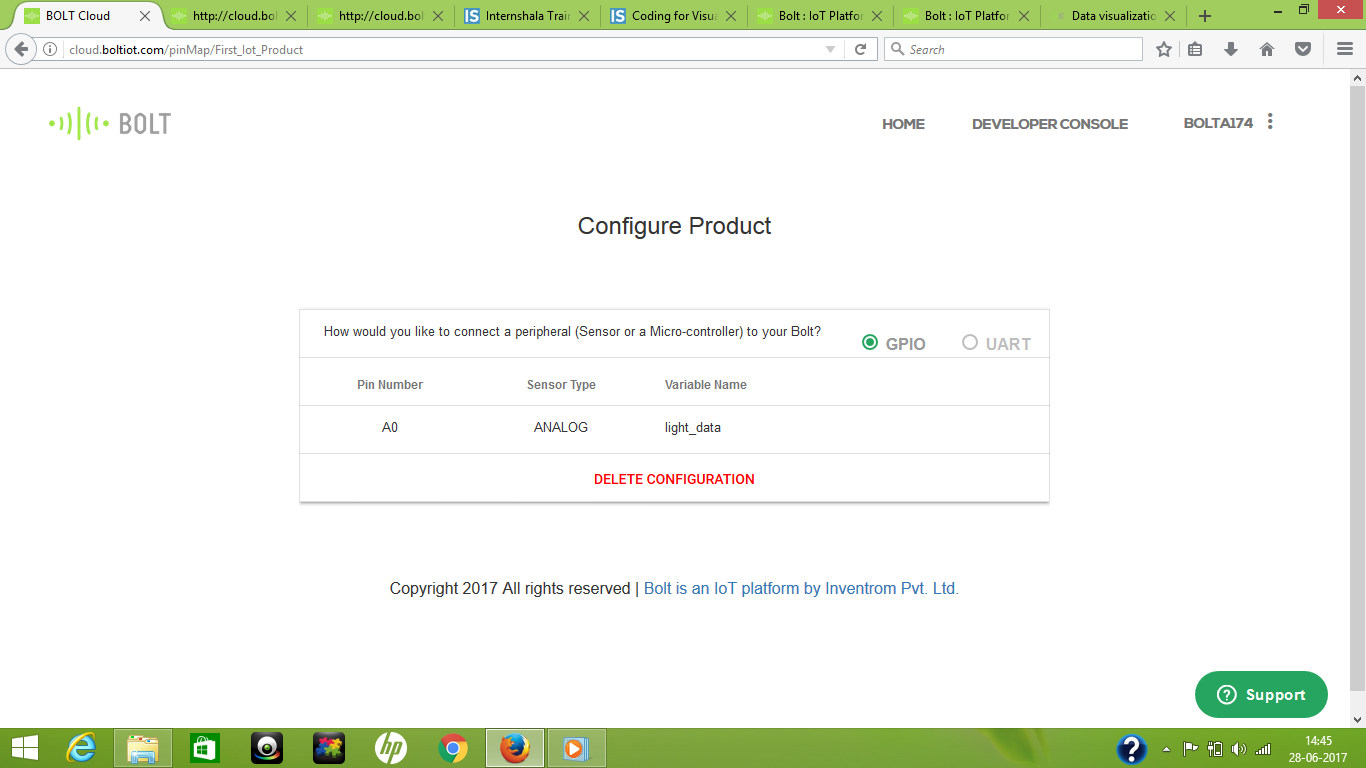
Your graph code is incorrect. Spaces are not allowed in the variable name. Go to hardware configuration section and delete the hardware configuration.Create a new hardware configuration and assign the variable name without spaces.
setChartLibrary("google-chart")
setChartType('lineGraph');
setAxisName('time_stamp', 'Voltage Value' );
plotChart('time_stamp', 'light_data');
Let me know in case you need further assistance.
1 Like
Where is this code snip supposed to go? As in which file?
@ghoshsamadrita3 The file should be uploaded with a .js extension. e.g. “sensor.js”. Upload this file using the developer console and link it to the product for which you want to plot the graph.
How to link it to the product, because it has only one linking space where I linked the Homepage HTML file
@ghoshsamadrita3 correct. You can link it using the Homepage dropdown. It will be displayed in the list displayed under the HomePage option.
1 Like
Done. But what about the blue dynamic graph? How to fix that?
Thank you! Its working finally!
@ghoshsamadrita3 great!  Let us know in case you face any other issues. Closing this thread since the issue is resolved.