I required a code for Data visulisation of LDR sensor which is connected to Arduino.
Explaniation : LDR sensor is connected to analog pin of Arduino and i am transmitting these signal values to BOLT through Serial port of Arduino for data visulisation.So,i required HTML code +Arduino code for that only.
Hi,
There is a tutorial for the same on this link https://www.instructables.com/id/Interfacing-Temperature-and-Humidity-SensorDHT22-W
This is made for a temperature and humidity sensor but the same will work for a LDR as well
Sir i have read the code and used to program but it is not working.
Below i have written the arduino code and html code for data visulisation of moisture sensor which is connected to arduino but it not working .There is no any graph showing on bolt page.
So please have a look at that and explain where is fault in the code.
ARDUINO CODE-
#include <SoftwareSerial.h>
SoftwareSerial mySerial(8,9);
String data;
//uint8_t dataRead = 0
void setup()
{
Serial.begin(9600);
mySerial.begin(9600);
}
void loop()
{
if (mySerial.available() > 0) {
delay(50);
String readData = “”;
Serial.print(“cmd from bolt:”);
while (mySerial.available() > 0 ) {
readData = readData + (char)mySerial.read();
}
Serial.println(readData);
if (readData.indexOf(“RD”) != -1) {
String data = sensor_data_to_push();
mySerial.print(data);
Serial.print(“data sent to bolt:”);
Serial.print(data);
}
}
}
String sensor_data_to_push() {
String data;
float hum = analogRead(A0);
data = String(hum);
return data;
}
HTML CODE-

       <!doctype html>
 <html>
 <head>
 <title>BOLT</title>
 <script src="https://cdnjs.cloudflare.com/ajax/libs/canvasjs/1.7.0/canvasjs.min.js"></script>
 </head>
 <body bgcolor="grey" >
 <center>
     <font color="skyblue" size="5px"><h3> <b>Data Visulation</b></h3> <br></font>
 <div id="chartContainer1" style="height: 30rem; padding-top:1rem;width:70%;box-shadow: 0px 1px 5px 0px #000;background: -webkit-linear-gradient(#0073A2, #2196f3);margin-top:0.05rem;"> </div>
 <script type="text/javascript">
 var dps1;
 var chart1;
 window.onload = function ()
 {
   dps1 = []; //dataPoints.
   chart1 = new CanvasJS.Chart("chartContainer1",{
    title :
     {
      text: "Soil Moisture Data "
     },
     backgroundColor: "transparent",
     height: 500,
       axisX:
       { title: "Time",
       labelFontFamily: "Segoe UI Light",
       lineThickness: 0,
       tickThickness: 0,
       labelFontColor:"white",
       titleFontColor: "white",
       titleFontFamily:"Segoe UI Light",
       },
       axisY:
        { stripLines:[
          { value:0,
          thickness:1,
          color: "white",
          }],
        tickThickness: 0.5,
        minimum: 0,
        maximum: 1450,
        title: "Soil moisture",
        labelFontFamily: "Segoe UI Light",
        gridThickness: 0,
        labelFontColor:"white",
        titleFontColor: "white",
        titleFontFamily:"Segoe UI Light",
        },
       data: [{
       type: "line",
       dataPoints : dps1,
       markerColor:"white",
       color:"white",
       }]
    });
     chart1.render();
     console.log("in on laod");
     var yVal = 15;
     var updateInterval = 5000;
     setInterval(5000);
     setBaud(9600);
     WRSerialData();
     setInterval(function(){sendSerialData()}, updateInterval);
}


function setBaud(baud) {
    var xmlhttp = new XMLHttpRequest();
    switch(baud) {
      case 2400:
        baud = 0;
        break;
      case 4800:
        baud = 1;
        break;
      case 9600:
        baud = 2;
        break;
      case 19255555200:
        baud = 3;
        break;
      default:
        baud = 4;
    }
    xmlhttp.onreadystatechange = function() {
      if (xmlhttp.readyState == 4 && xmlhttp.status == 200) {
        {
        }
      }
    };
    xmlhttp.open("GET","/serialBegin?baud=2&deviceName={{Name}}",true);
    xmlhttp.send();
  }


function WRSerialData() {
    var xmlhttp = new XMLHttpRequest();
    xmlhttp.onreadystatechange = function() {
      if (xmlhttp.readyState == 4 && xmlhttp.status == 200) {
        var obj = JSON.parse(xmlhttp.responseText);
        if(obj.success=="1")
        {
          x = xmlhttp.responseText
          obj = JSON.parse(x);
          hAndT = obj.value
          if( hAndT.indexOf("empty") == -1 )
          {
            var commaIndex = hAndT.indexOf(",") ;
            var soil = "";
            for (var i = 0; i < commaIndex; i++) {
              soil = soil + hAndT[i];
            }
            soil = parseFloat(soil);
          }
        }
        else{
        }
      }
    };
    xmlhttp.open("GET","/serialWR?data=hello&deviceName={{Name}}",true);
    xmlhttp.send();
  }


 function updateChart1(soil)
     {
          yVal = parseInt(soil);
          var xVal = new Date();
          dps1.push({x: xVal,y: yVal});
           if (dps1.length > 5 )
           {
             dps1.shift();
           }
          chart1.render();
     }


function sendSerialData(serialdata) {
    var xmlhttp = new XMLHttpRequest();
    xmlhttp.onreadystatechange = function() {
      if (xmlhttp.readyState == 4 && xmlhttp.status == 200) {
        {
        var obj = JSON.parse(xmlhttp.responseText);
        if(obj.success=="1")
        {
          x = xmlhttp.responseText
          obj = JSON.parse(x);
          hAndT = obj.value
          if( hAndT.indexOf("empty") == -1 )
          {
            var commaIndex = hAndT.indexOf(",") ;
            var soil = "";
            for (var i = 0; i < commaIndex; i++) {
              soil = soil + hAndT[i];
            }
            soil = parseFloat(soil);
            updateChart1(soil);
          }
        }
        else{
        }
        }
      }
    };
    xmlhttp.open("GET","/serialWR?data=hello&deviceName={{Name}}",true);
    xmlhttp.send();
}
 </script>
 </center>
 </body>
</html>Hi ,
Do console log of the HTML page and see if any error or warning message is there.
There is one simple method to plot a graph on bolt cloud. Use hardware configuration to plot a graph on bolt cloud.
-
Go to Developer Console - > Product - > Click on hardware icon for a product - > Then choose UART ->Choose the number of Comma separated value you want to send.
-
Now upload the 4-5 line of code of javascript to plot the graph.
setChartType(‘lineGraph’);
plotChart(‘time_stamp’,‘ldr’);
Save this file with .js extension For example ldr.js
and link this page with the product.
Let me know in case you need further assistance.
what is the meaning of this “RD” command and how do i write html code for sending this “RD” command to arduino
Hi,
You do not need to code it HTML. Once your create a hardware config for your Bolt as shown in the Tutorials , the Bolt will keep sending the RD command to your arduino UART every 5mins
Ihave tried the above mentioned steps but i an not getting the Graph .
STEP1-
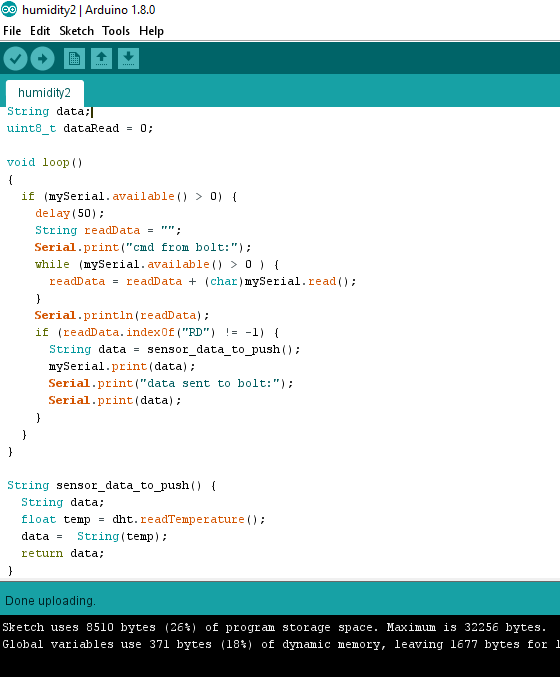
ARDUINO CODE for DHT22 sensor for sensing temperature
#include <SoftwareSerial.h>
#include <DHT.h>
SoftwareSerial mySerial(8,9);
//Constants
#define DHTPIN 2 // what pin we’re connected to
#define DHTTYPE DHT22 // DHT 22 (AM2302)
DHT dht(DHTPIN, DHTTYPE); //// Initialize DHT sensor for normal 16mhz Arduino
void setup()
{
Serial.begin(9600);
mySerial.begin(9600);
dht.begin();
Serial.setTimeout(100);
}
String data;
uint8_t dataRead = 0;
void loop()
{
if (mySerial.available() > 0) {
delay(50);
String readData = “”;
Serial.print(“cmd from bolt:”);
while (mySerial.available() > 0 ) {
readData = readData + (char)mySerial.read();
}
Serial.println(readData);
if (readData.indexOf(“RD”) != -1) {
String data = sensor_data_to_push();
mySerial.print(data);
Serial.print(“data sent to bolt:”);
Serial.print(data);
}
}
}
String sensor_data_to_push() {
String data;
float temp = dht.readTemperature();
data = String(temp);
return data;
}
STEP 2
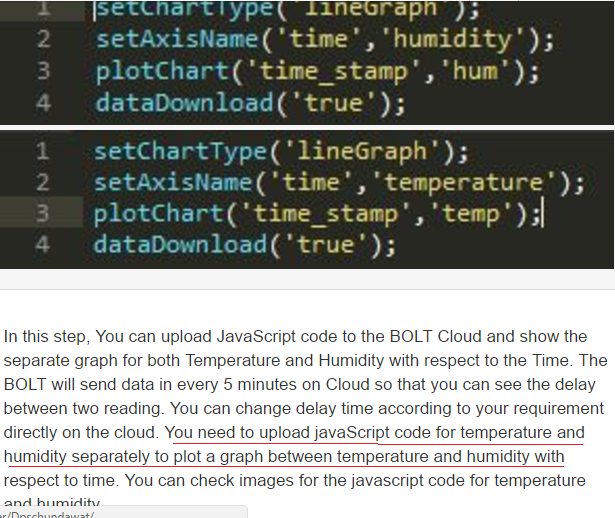
Javascript code for graph
setChartType(‘lineGraph’);
plotChart(‘time_stamp’,‘temp’);
STEP 3
Hardware circuit for sending temperature data from arduino to bolt

STEP 4
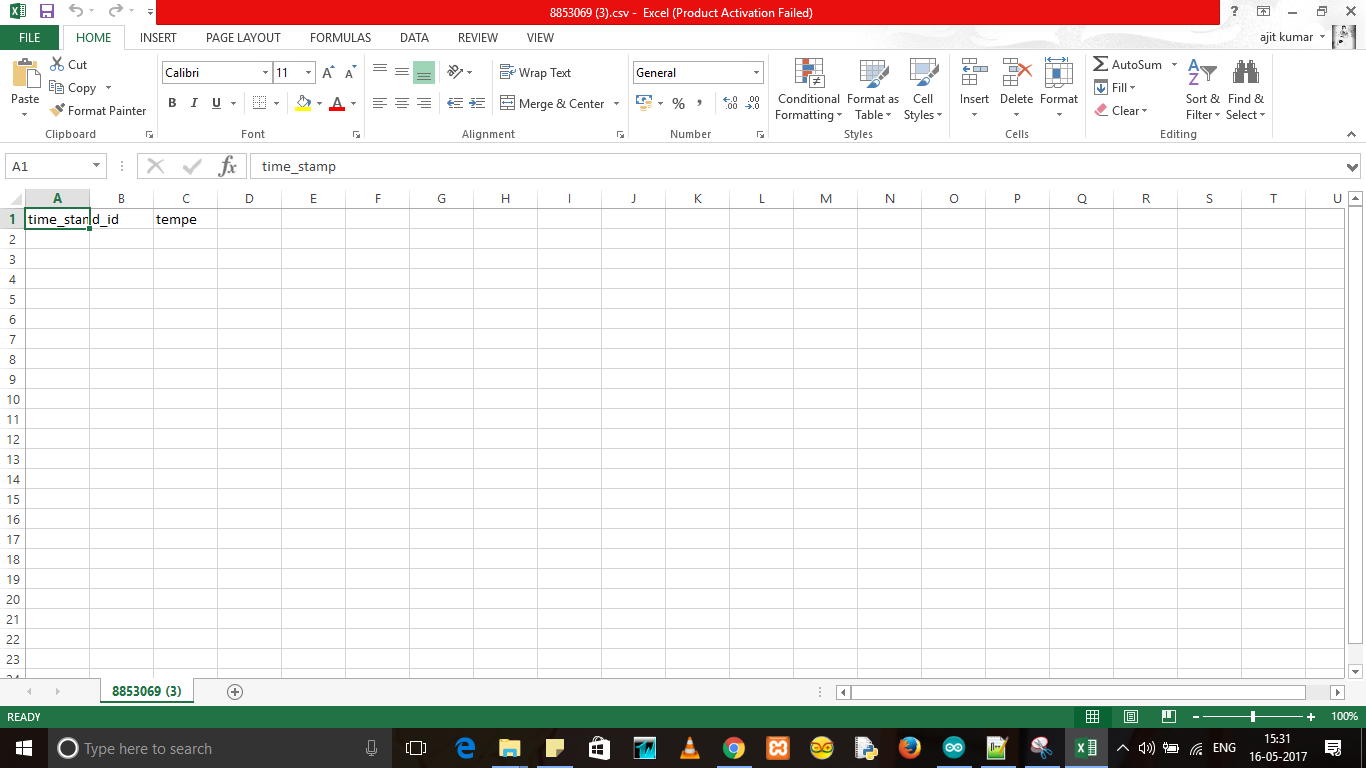
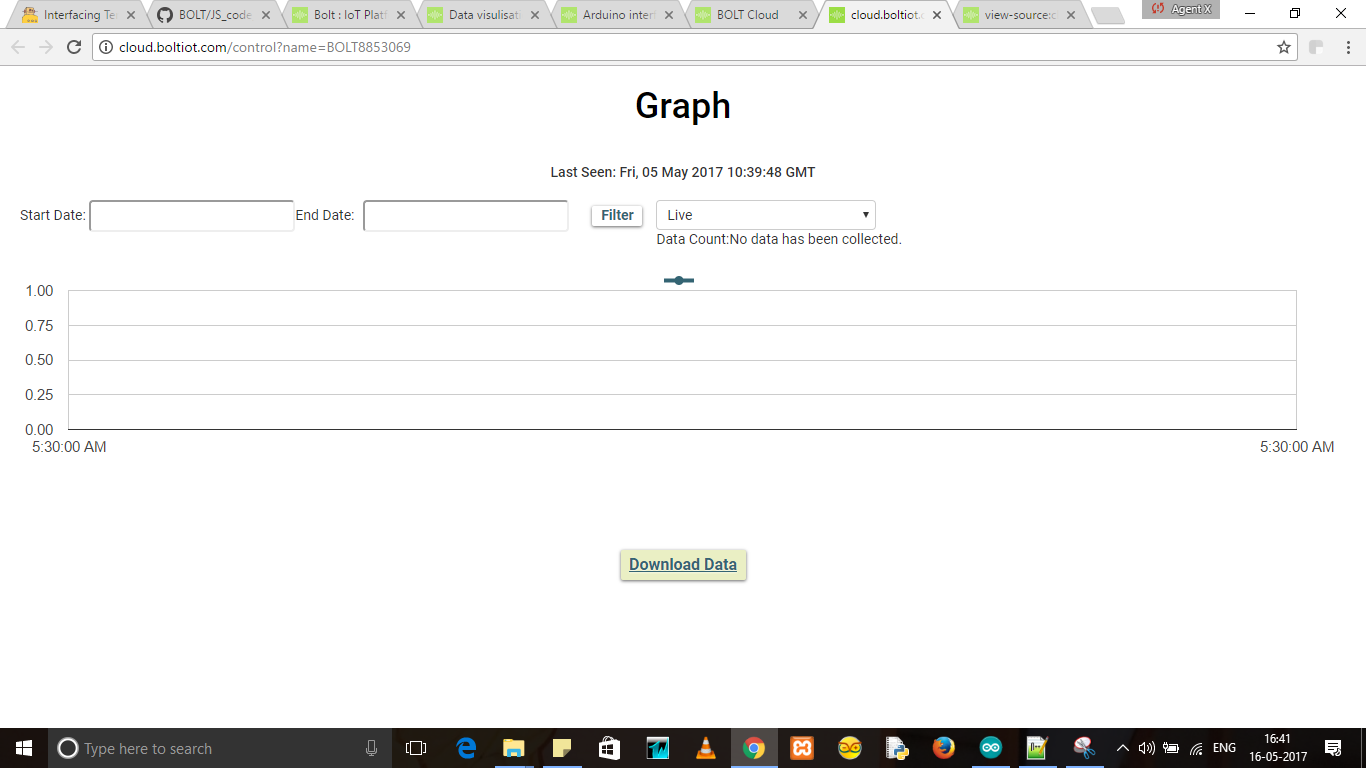
i am getting the graph wep page which i attached screenshort; not the graph which i require

So the problem is that i am still not able to get graph like this
Hi,
Can you click on the download data button and show me what is the content of the CSV file that get downloaded
Hi,
I see two issues here
-
You have not deployed the configuration to the Bolt and
-
Your variable name is tempe. This should be used as it in the line of the JS file
plotChart(‘time_stamp’,‘tempe’)
I have corrected my mistake but again the graph doesen’t contain any single point even after 5 minutes
Hi,
If you have teamviewer can you share the password and id with me on my email id datta.naik@inventrom.com
yes sir, i have send the id and password of teamviewer on your mail id
The power supply of my BOLT has been broken. So, i am giving the power to bolt by Arduino 5V pin.
Will it affect the performance of BOLT or it is ok?
Thank you sir for your kind support.
Now, i want to add another graph in the same device name.For that it is posted on instructables that i have to upload two different js files. But how can two different files can be uploaded to same device.
I have done all these steps in hardware configuration- select UART option and then choose how many commas separated value you want. For eg - we want 2 value for temperature and humidity.Give a variable name to both values. A Select delay between two values for eg - 5 minutes. Click on OK. And then FINISH.
Hi @ajitrahulraj1995
Currently, you can plot only one graph at a time . We will add multiple graph option soon.
No it will not affect performance. You can use power from the arduino without any issues.
Hi,
The you can have multiple files uploaded to cloud but at a time only one file can be associated with a product. You can change the file associated with the product on the go to view a diff graph.
We are going to push an update soon to make multiple graphs
Hi…i am a new user here. As per my knowledge you should do console log of the HTML page and see if any error or warning message is there.There is one simple method to plot a graph on bolt cloud. Use hardware configuration to plot a graph on bolt cloud.Go to Developer Console - > Product - > Click on hardware icon for a product - > Then choose UART ->Choose the number of Comma separated value you want to send.