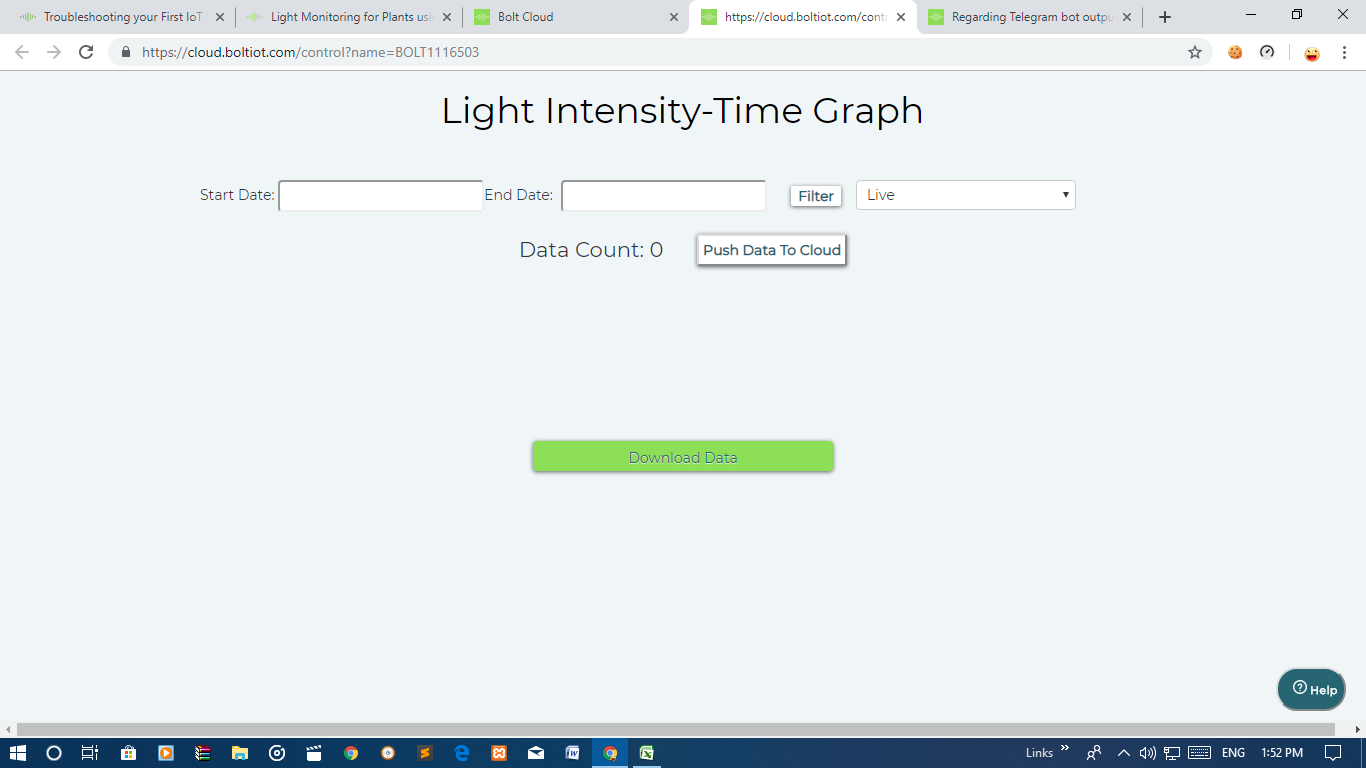
When I press view device option after successful setup as mentioned in the project it doesn’t display any graph. Also the data count is indicated as zero. A blank excel sheet is downloaded on pressing the Download data button.
Check whether the LEDs are ON during deploying configuration.Also check the connection of the resistor between ground and A0 pin.Make sure your code is correct and that the correct variable name is assigned to the correct pin.
click the deploying button and check…If it doesn’t work check the connections you made.like the two devices does not touch each other.and also the two LEDs are ON.
Check your hardware connection once again & the variable name in the code should be same with the name you have declared as an variable name so check the code once again specially check the functions used in the code for plotting the graph.
@apvaishak9 Check the variable name in the code. It should be the same as the one in the hardware config.
- Check the LEDs have stable connection
- Check Wifi connection
- Check your LDR and resistor for any fault
- Check variable name assigned in the code
5.Check whether deploy configuration is successful
Check your hardware connection and correct your code.
use plotChart(“time_stamp”,“light”) code for reading and to show line graph then use setChartType(“lineGraph”);
Problem solved. The problem was with my browser