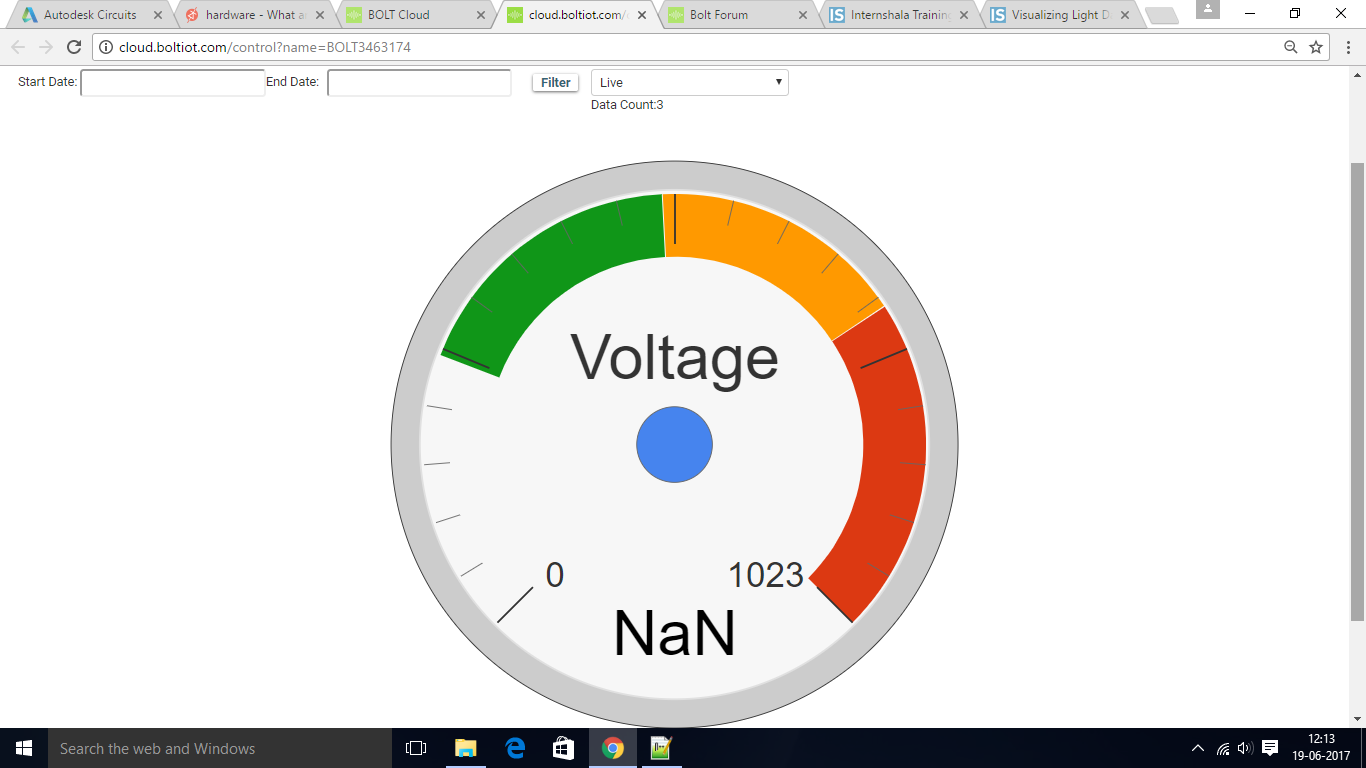
While setting up the hardware configurations for my Bolt device which uses and LDR sensor for light detection, I named the variable as light_data. At first I tried using the line chart to visualize the data and it worked fine. Next I used the gauge chart with the code given below, but it is not working. The pointer is not showing in the diagram, the data points remains static at 3, and the value shows NaN. I cannot make out what is going wrong.
    setChartLibrary("google-chart");
    setChartType('gauge');
    setAxisName('Voltage');
    setDimentions(700,700);
    setMaxValue(1023);
    setRed(726,1023);
    setYellow(501,725);
    setGreen(250,500);
    setMinorTicks(5);
    plotChart('light_data');
    dataDownload('true');
Hi @banerjeesumitabha18 ,
Send the screenshot of your hardware configuration also.
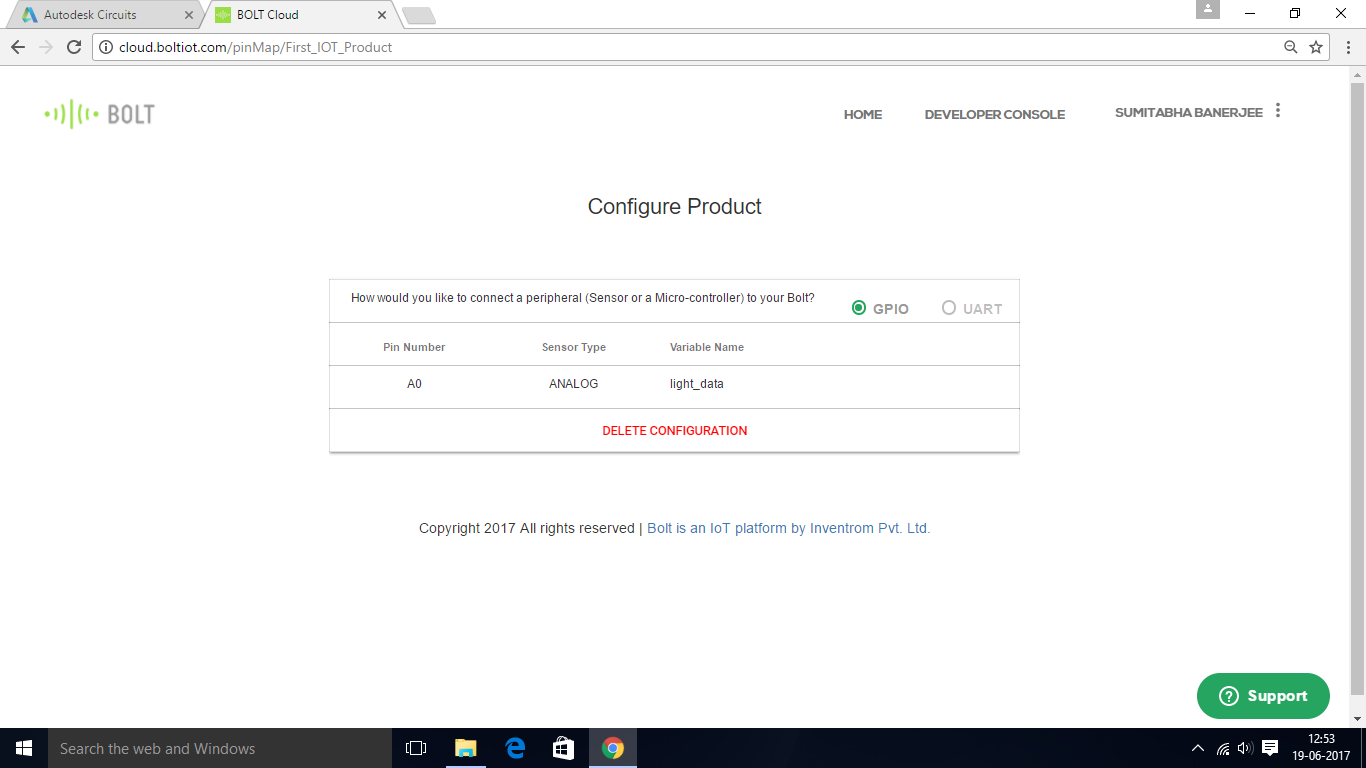
Here is my hardware configuration
@banerjeesumitabha18,
Please share your device with me on Bolt Cloud. My email id rahul.singh@inventrom.com .
Yes I have done that. Please check. My device ID is BOLT3463174.
Hi @banerjeesumitabha18 ,
I can see the line graph for your device. Please upload the code for Gauge Graph.
i am facing same problem will you please help me to short it out
It is already there as gauge.js. Now I have set the homepage also as the gauge chart instead of line chart. Please check
Hi @banerjeesumitabha18 ,
Please try this, in setAxisName type the same name as variable name
setChartType('gauge');
setAxisName('light_data');
setDimentions(700,700);
setMaxValue(1023);
setRed(726,1023);
setYellow(501,725);
setGreen(250,500);
setMinorTicks(5);
plotChart('light_data');
dataDownload('true');
setChartType(); This function is used to set the graph type . For example : setChartType(‘lineGraph’);
setAxisName(); This function is used to set the axis name but in case of gauge type the variable name that you have created during hardware configuration as a arguments.
setDimentions(); This function is used to set the Height and width of graph.
setMaxValue(); is used to define the max value of gauge graph.
setRed(), setYellow(), setGreen() is used to set the colour of graph.
setMinorTicks(); The number of minor tick section in each major tick section .
plotChart(); This function will plot the chart also you need to pass the variable name that you have created during hardware configuration as a arguments.
1 Like
Yes now it is working. Thanks a lot.
i got the same problem i.e my guage chart is not working. I’ve even used your code and now it’s showing error at setDimension(); and why is that i’m not able to figure it out.
Hi @shristisingh02,
Please share a screenshot of your code along with a screenshot of your hardware configurations so that we can better understand the issue.
1 Like
thanks for responding but i figured it out.
1 Like
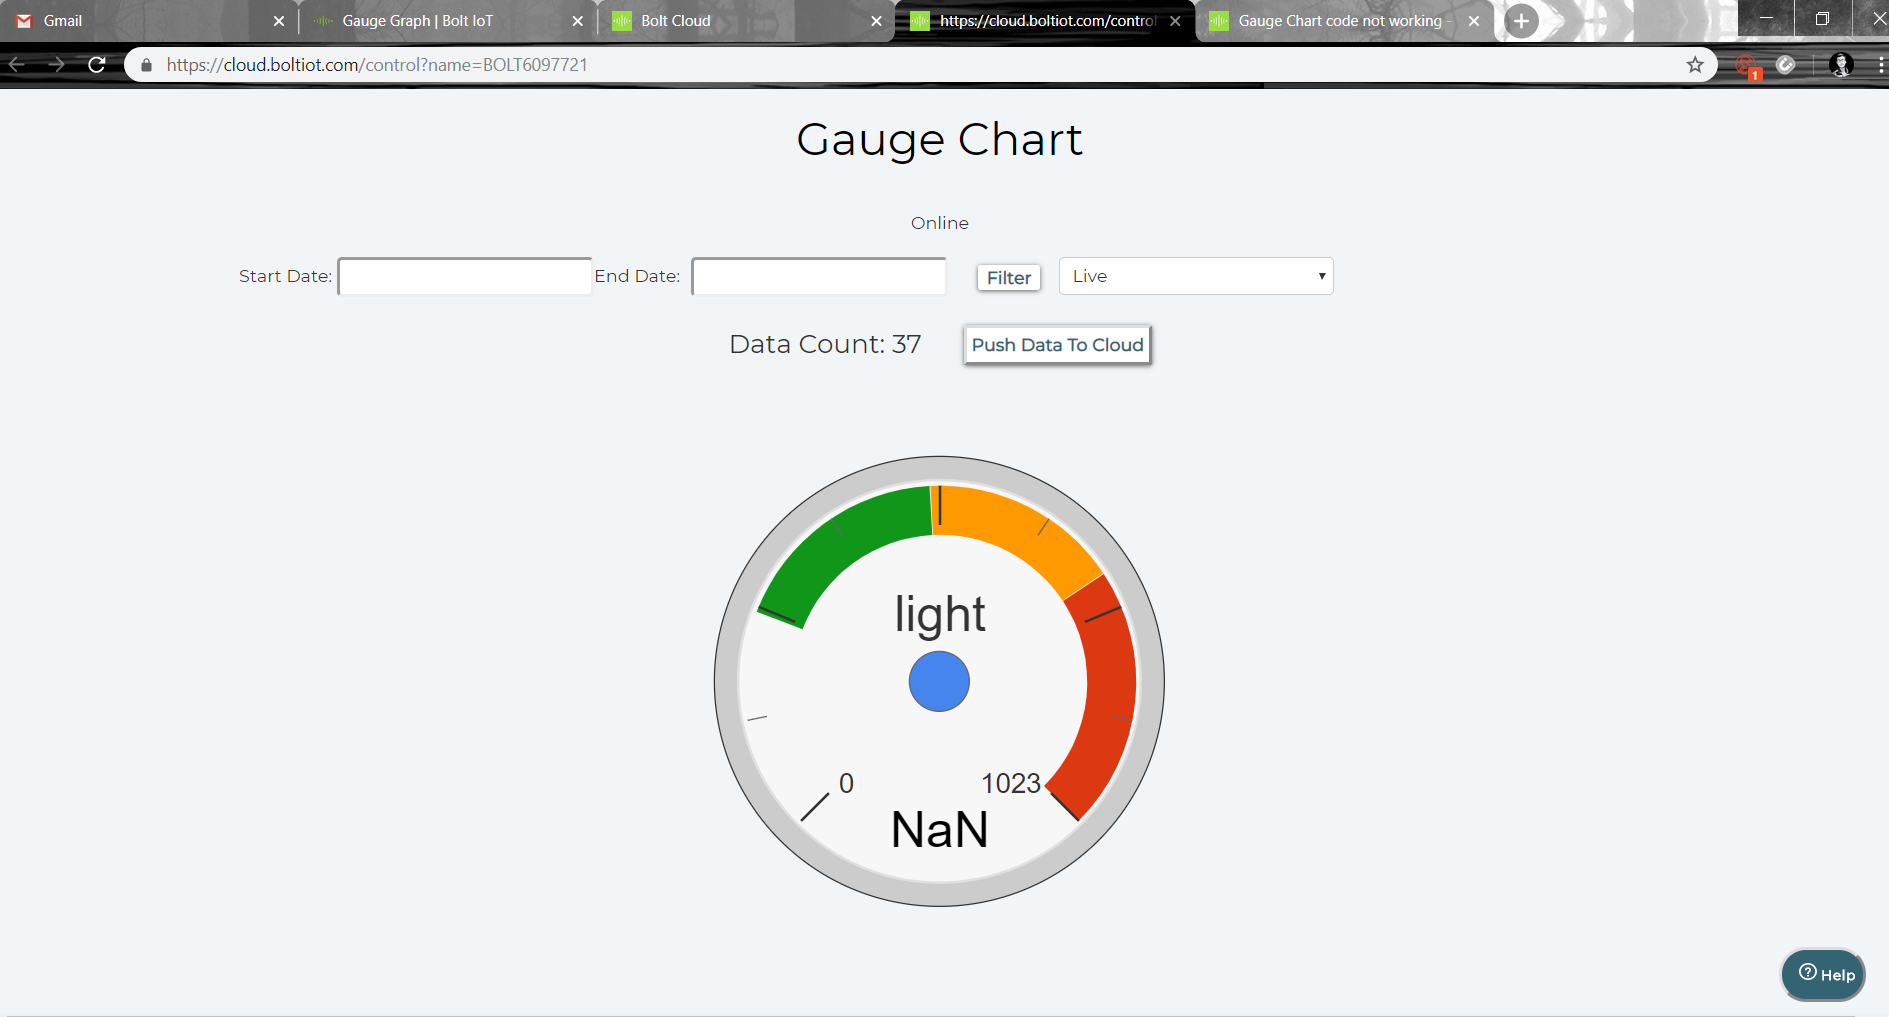
I am facing exactly the same problem. However, my code is little bit diiferent. When I try the code given above, it shows error in my plotchart function.
Here is my code:-
setChartLibrary("google-chart");
setChartTitle('Gauge Chart');
setChartType('gauge');
setAxisName('light');
setDimensions(400,400);
setMaxValue(1023);
setGreen(250,500);
setYellow(501,725);
setRed(726,1023);
plotChart("time_stamp", "light");
Here is my Graph page:-
Kindly Help. It would be appreciated.
Hi @choudharyaakash066,
Gauge graph only takes one parameter in the plotChart() function. Check the below code.
setChartLibrary("google-chart");
setChartTitle('Gauge Chart');
setChartType('gauge');
setAxisName('light');
setDimensions(400,400);
setMaxValue(1023);
setGreen(250,500);
setYellow(501,725);
setRed(726,1023);
plotChart("light");
Refer this link https://docs.boltiot.com/docs/gauge
Do let me know in case you need any other information.
It Worked Sir. Thank you so very much for responding.
1 Like