Can you drop in at our office in panjim so that we could have a look?
1 Like
Hey hi,
I have the same issue, I just get the graph with increasing in time and no plotting.
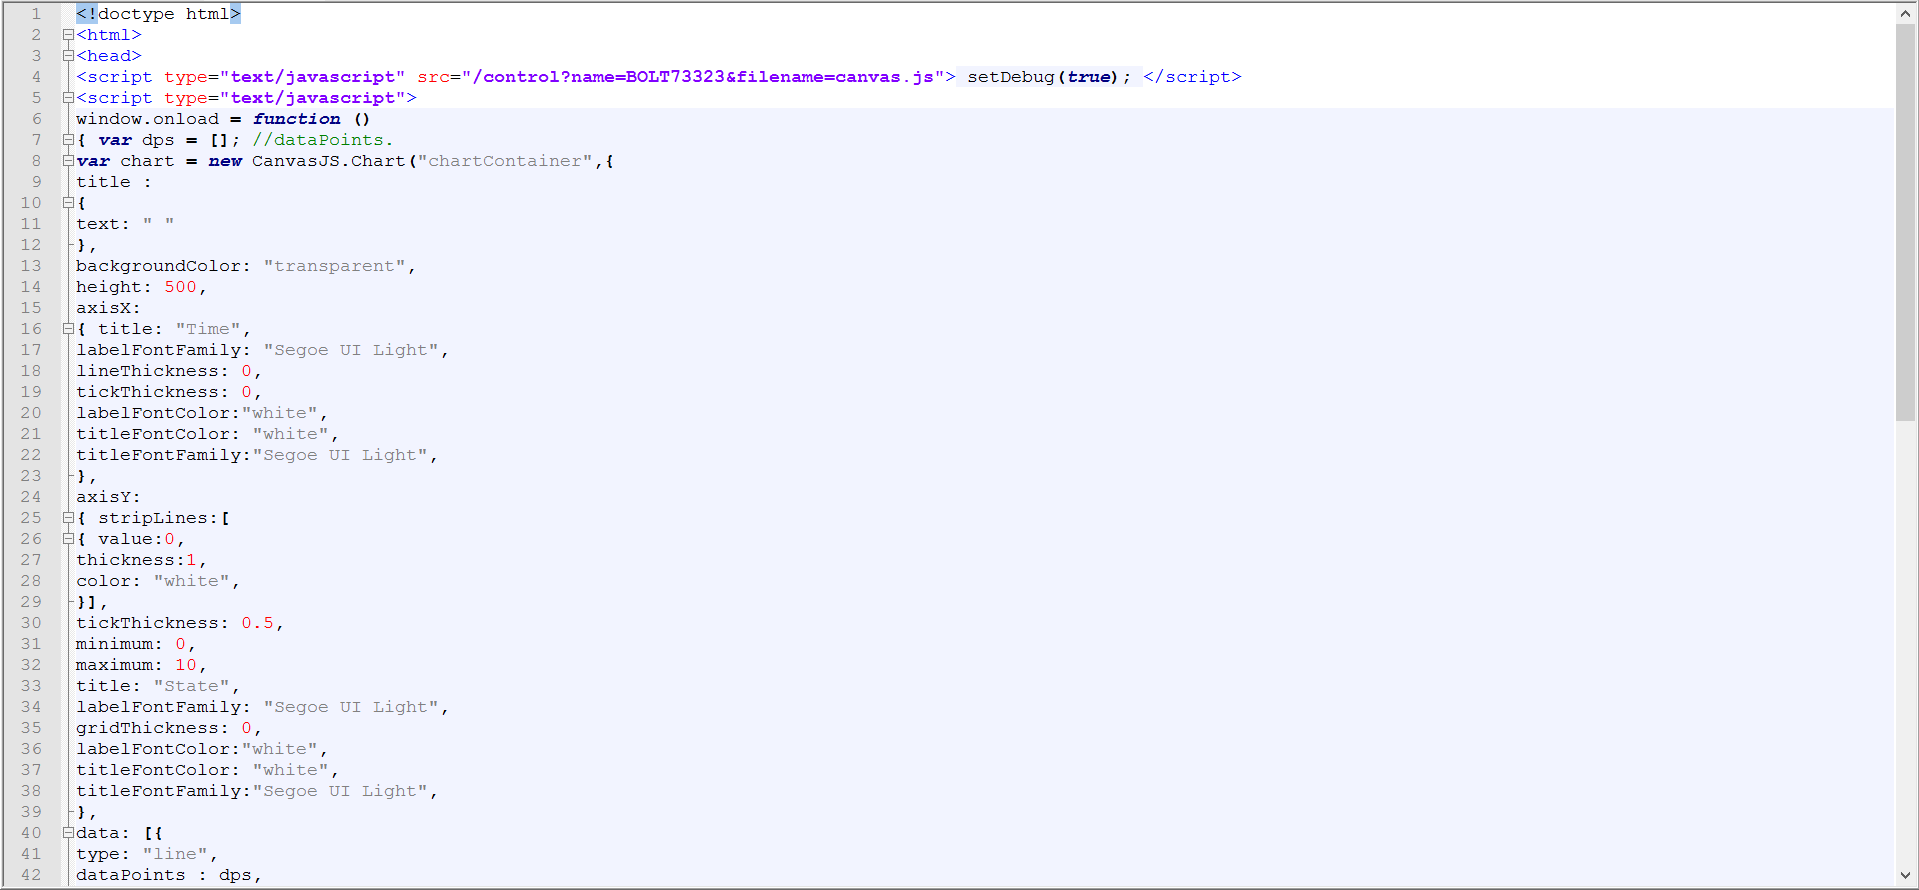
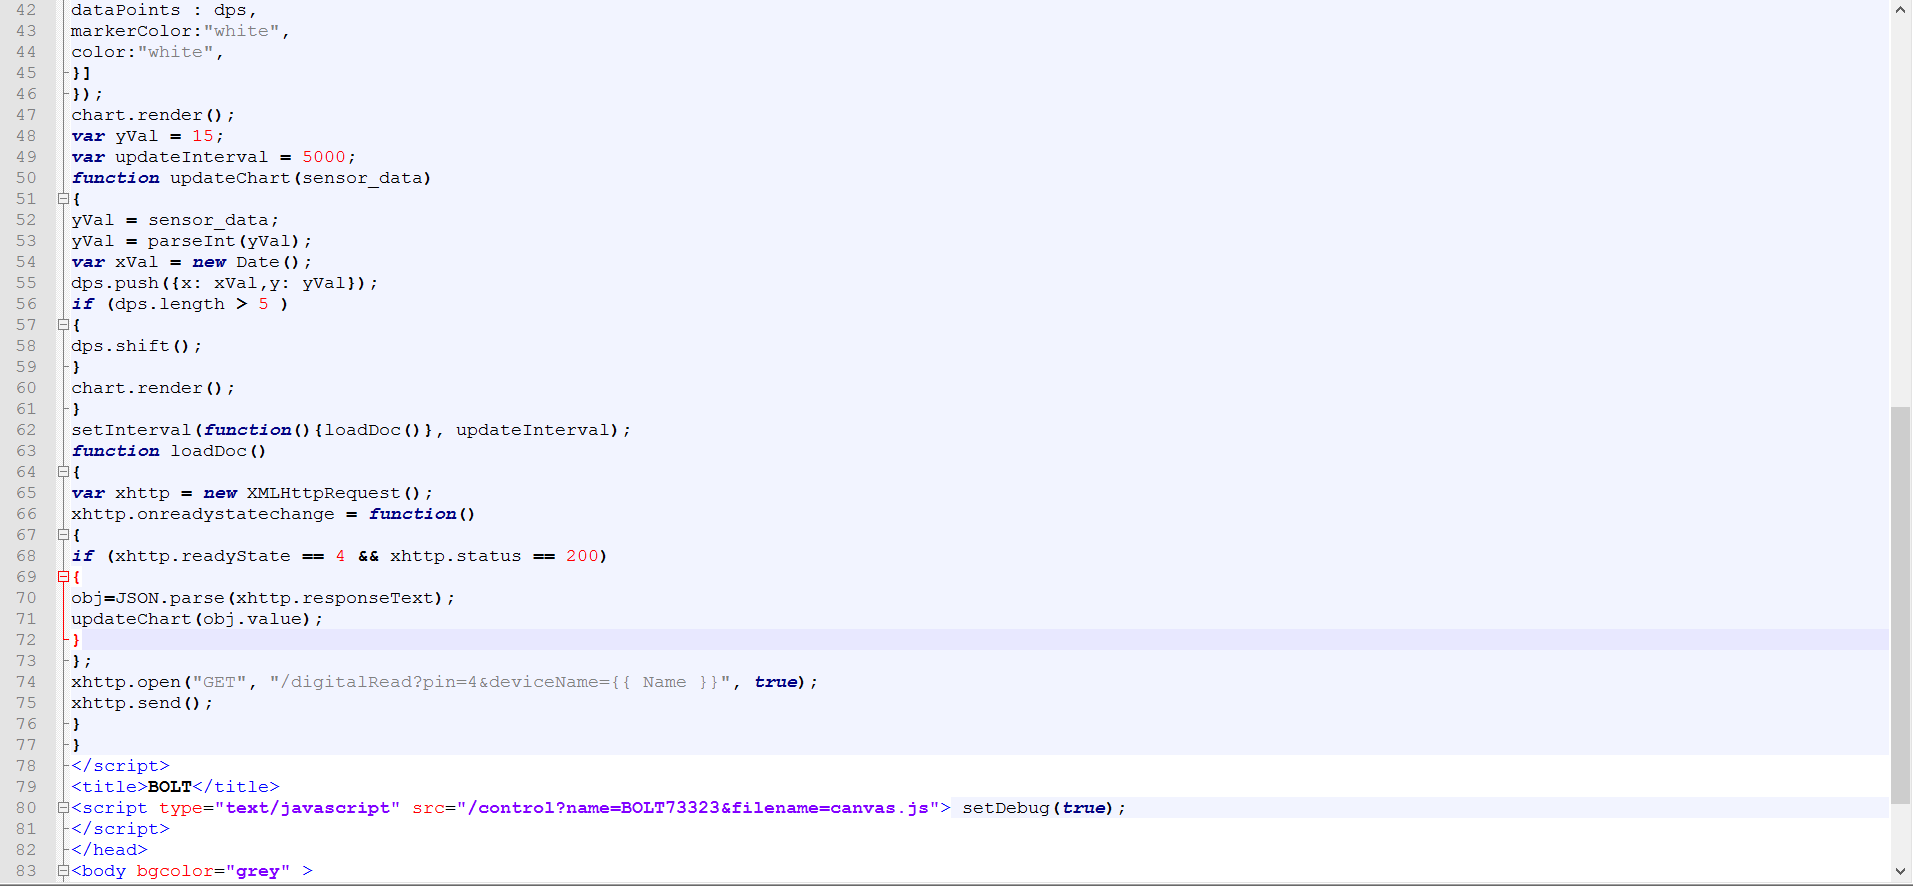
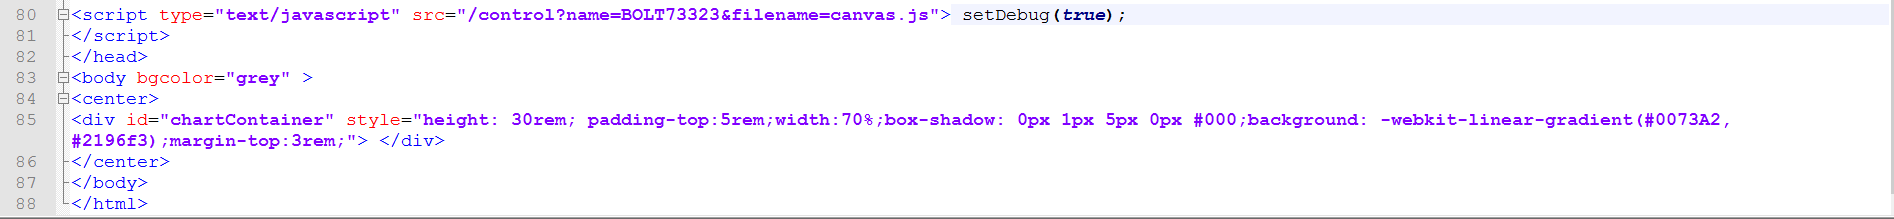
Code goes as below,
BOLT
Kindly check and advise!
I suggest you register for the Beta Tester program and use the latest system for graph that has been launched to the beta testers. Do give your feedback via the small feedback box on the right hand side.
Ya I registered for the beta tester program, kindly advise how to use it, like viewing graph and stuff!!
First login to your boltiot workshop and then open the link given below. We have given proper document in this link.
1 Like
Will check. Thanks you!
firstly, I uploaded the canavas.js file and then the index.htm file, but I can’t see the graph plotted after it is plotted once
also, I tried all the steps mentioned in the page
Data Visualisation Incorrect Graph.
Hers’s my HTML code
In Bolt Cloud:
- Create a new Product
- Write the code as given here: https://www.boltiot.com/app/workshop-content-beta.php
- Upload and assign that file to your device.
- Assign the product to your device.
Note: Types are now known as products.
Hi,
I am facing the same issue and the link given is not working.
Plz look into it asap.
@avishek.abhi64 Try this link https://www.boltiot.com/app/workshop-content-beta.php
The above link has been updated now.