result is only tabulated in the form of a table in cloud,but subsequent plots are not coming although i used “setChartLibrary('google-chart)” and "setChartType('linegraph).
please help.btw my project was on “light monitoring system”
result is only tabulated in the form of a table in cloud,but subsequent plots are not coming although i used “setChartLibrary('google-chart)” and "setChartType('linegraph).
please help.btw my project was on “light monitoring system”
Hello,
You have written “setChartLibrary('google-chart)” and "setChartType('linegraph).
In your case you have not follow the proper syntax/format to write the code so that’s why you are not getting your plot on your output screen.
Please do some changes in your code.
Write these code in your code section :
Hope this will help you.
Have a good day!
Then check your hardware connections and also check jumper wires.
It is possible that the jumper wires are not working properly.
@aritra.bose.ece20 were you checking the device while it was ON or did you just wanted to see the graph of data which was collected earlier.
If you wanted to see the readings from some time back then you can view it by selecting 1 month instead of live.
i worked on fresh data, tabular form reading was shown,only problem arises out during plotting
tabular form reading was shown,only problem arises out during plotting, if circuit connection would perhaps be faulty, would the tabular form data have been shown correctly?
please suggest me to fix…
Hi
If your only desire is to get the output in Linegraph then i can help you.
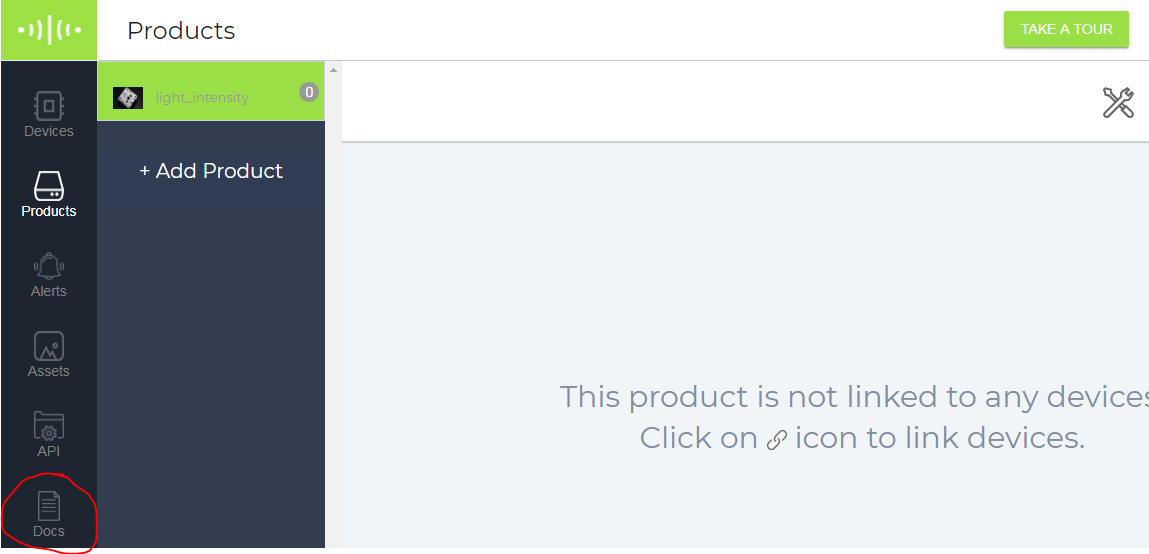
Go to the Bolt Cloud bolt%20forum|690x332 and now click on the docs option available on the screen!
and now under the heading GETTING STARTED you can find Light Monitoring for Plants using Bolt, Click on that option and follow all the steps shown and there you can choose any graph which you want to see the output.
Correct setChartType(‘linegraph’) to:
setChartType(‘lineGraph’);

